The Benefits of Using Multiple Time Frame Analysis
The Benefits of Using Multiple Time Frame Analysis
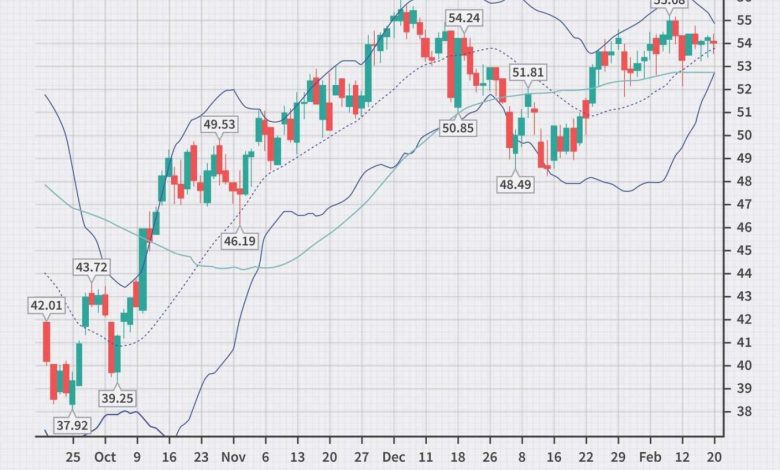
What is Multiple Time Frame Analysis?
Multiple Time Frame Analysis is a technical analysis strategy that involves studying price movement across different time frames simultaneously. Traders and investors use this approach to gain a comprehensive understanding of the market and make more informed trading decisions.
The Advantages of Multiple Time Frame Analysis
1. Enhanced Market Perspective
By analyzing price movements on different time frames, traders can gain a broader perspective of the market. This allows them to identify key trends, patterns, and support/resistance levels that may not be visible on a single time frame chart. The ability to see the bigger picture helps traders avoid false signals and better predict market direction.
2. Improved Entry and Exit Points
Multiple Time Frame Analysis allows traders to identify optimal entry and exit points for their trades. By aligning shorter-term and longer-term trends, traders can time their trades more accurately. For example, if the short-term trend is bullish, but the long-term trend is bearish, traders can wait for the two trends to align before entering a trade to increase the probability of success.
3. Confirmation of Signals
Using multiple time frames can help confirm trading signals. When a signal, such as a trendline break or a moving average crossover, occurs on multiple time frames, it adds more credibility to the signal. This helps traders avoid false breakouts and filter out noise from the market.
4. Risk Management
Multiple Time Frame Analysis can also assist in better risk management. By analyzing different time frames, traders can identify key support/resistance levels and determine appropriate stop-loss levels. This helps in setting realistic profit targets and managing risk effectively, leading to improved trading outcomes.
Frequently Asked Questions (FAQs)
Q: Is Multiple Time Frame Analysis suitable for all types of traders?
Yes, Multiple Time Frame Analysis can be utilized by all types of traders, whether they are day traders, swing traders, or long-term investors. The strategy can be applied to any market, such as stocks, forex, commodities, or cryptocurrencies.
Q: How many time frames should I use for analysis?
The number of time frames to use for analysis depends on individual preferences and trading style. Typically, traders use a combination of three time frames: short-term (e.g., hourly), medium-term (e.g., daily), and long-term (e.g., weekly or monthly). This combination provides a balanced view of the market.
Q: How should I interpret conflicting signals on different time frames?
Conflicting signals on different time frames can be challenging to interpret. In such cases, it’s crucial to consider the overall trend determined by the longer-term time frame. If the long-term trend is bullish, short-term bearish signals may be considered as potential buying opportunities. However, it’s important to use additional technical indicators and fundamental analysis to validate the signals.
Q: Can I automate multiple time frame analysis?
Yes, multiple time frame analysis can be automated using trading software and indicators. These tools can help scan multiple time frames simultaneously and generate signals based on predefined criteria. However, it’s essential to understand the underlying principles of multiple time frame analysis to interpret and utilize the automated signals effectively.
In conclusion, Multiple Time Frame Analysis is a powerful tool that can significantly enhance a trader’s decision-making process. By analyzing price movements across different time frames, traders gain a broader perspective of the market, improve their entry and exit points, confirm signals, and manage risk more effectively. Incorporating this strategy into your trading routine can lead to improved trading outcomes and increased profitability.